import numpy as np
# the random data
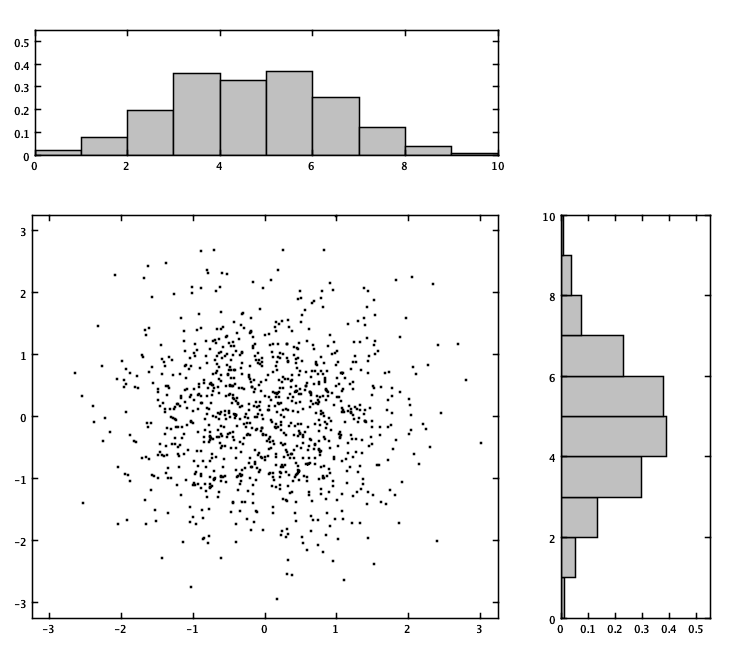
x = np.random.randn(1000)
y = np.random.randn(1000)
# ... and the Py4j gateway
from py4j.java_gateway import JavaGateway
# Set up the gateway - this connects to the GraphExplorer.jar JVM
# which needs to be running
gateway=JavaGateway(auto_convert=True)
# Use WPlot for this example - need to import this from
# the gateway JVM
WPlot=gateway.jvm.kcl.waterloo.plot.WPlot
# the scatter plot:
p=WPlot.scatter(['xData', x, 'yData', y, 'marker', '.'])
f=p.createFrame()
# Using createFrame as above is convenient (and thread-safe)
# but creates a 1x1 grid. Adding the scatter plot again
# (which removes then adds it under-the-hood) can be used to create
# a different grid.
f.getGraphicsContainer().getGrid().add(p.getPlot().getParentGraph().getGraphContainer(),2.,0.,5.,5.)
# Add a histogram to show the density of point along the x-axis...
g1=gateway.jvm.kcl.waterloo.graphics.GJGraphContainer.createInstance( \
gateway.jvm.kcl.waterloo.graphics.GJGraph.createInstance())
h1=np.histogram(x, density=True)
p2=WPlot.bar(['xData', np.arange(0,len(h1[0])), 'yData', h1[0], \
'mode', gateway.jvm.kcl.waterloo.graphics.plots2D.BarExtra.MODE.HISTC])
g1.getView().add(p2.getPlot())
g1.getView().setAxesBounds(0.,0.,10.,0.55)
f.add(g1,0.,0.,5.,2.,0)
# ... and another for the y-axis...
g2=gateway.jvm.kcl.waterloo.graphics.GJGraphContainer.createInstance( \
gateway.jvm.kcl.waterloo.graphics.GJGraph.createInstance())
h2=np.histogram(y, density=True)
p3=WPlot.bar(['xData', np.arange(0,len(h2[0])), 'yData', h2[0], \
'mode', gateway.jvm.kcl.waterloo.graphics.plots2D.BarExtra.MODE.HISTC, \
'orientation', 'horizontal'])
g2.getView().add(p3.getPlot())
# Note here that the x- and y- axes are not swapped
g2.getView().setAxesBounds(0., 0., 0.55, 10.0)
f.add(g2,2.,5.,2.,5.,0)
f.setAlwaysOnTop(True)
WPlot=None