JavaFX Examples
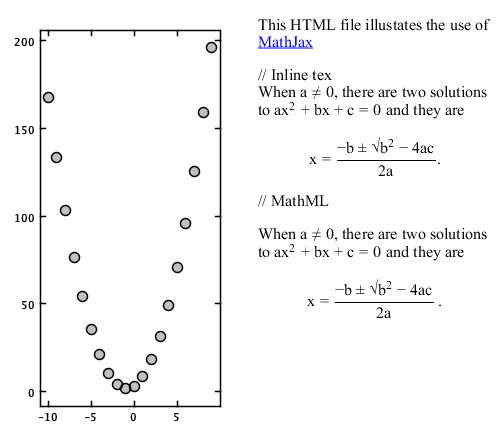
These examples illustrate the use of JavaFX with Waterloo charts.This creates a Waterloo graph inside Swing hierarchy and add JavaFX content to a JFXPanel.
package kcl.waterloo.jfx;

import java.awt.EventQueue;
import java.lang.reflect.InvocationTargetException;
import javafx.application.Platform;
import javafx.embed.swing.JFXPanel;
import javafx.scene.Scene;
import javafx.scene.web.WebEngine;
import javafx.scene.web.WebView;
import kcl.waterloo.graphics.GJGraph;
import kcl.waterloo.graphics.GJGraphContainer;
import kcl.waterloo.graphics.plots2D.GJPlotInterface;
import kcl.waterloo.graphics.plots2D.GJScatter;
import kcl.waterloo.swing.GCFrame;

/**
 *
 * @author ML
 */
public class MathJax {

    /**
     * This example plots a scatter plot alongside a web page in a
     * JavaFX WebView.
     *
     * The WebView is added to the Swing layout using a JFXPanel.
     *
     * @param args the command line arguments
     */
    public static void main(String[] args) throws InterruptedException, InvocationTargetException {
        EventQueue.invokeAndWait(new Runnable() {
            // Create the Swing components on the EDT
            @Override
            public void run() {
                GCFrame f = new GCFrame();
                GJGraphContainer gc = GJGraphContainer.createInstance(GJGraph.createInstance());
                f.add(gc);

                // Create a plot a quadratic
                double[] x= new double[20];
                double[] y= new double[20];
                for (int k=0;k<20;k++){
                    x[k]=k-10d;
                    y[k]=2d*Math.pow(x[k],2d)+3.5d*x[k]+3d;
                }
                GJPlotInterface p=GJScatter.createInstance();
                p.setXData(x);
                p.setYData(y);

                gc.getView().add(p);
                gc.getView().autoScale();

                // Describe the plot in a WebView using MathJax
                final JFXPanel jfx = new JFXPanel();
                f.add(jfx, 0, 1., 1., 1., 0);

                // Add the web page on the JavaFX thread
                Platform.runLater(new Runnable() {
                    @Override
                    public void run() {
                        final WebView browser = new WebView();
                        final WebEngine webEngine = browser.getEngine();
                        // This is a reference to a web page on the Waterloo web site
                        webEngine.load("http://waterloo.sourceforge.net/MathJax/mathjax.html");
                        Scene s = new Scene(browser);
                        jfx.setScene(s);
                        webEngine.reload();
                    }
                });

            }
        });
    }

}
