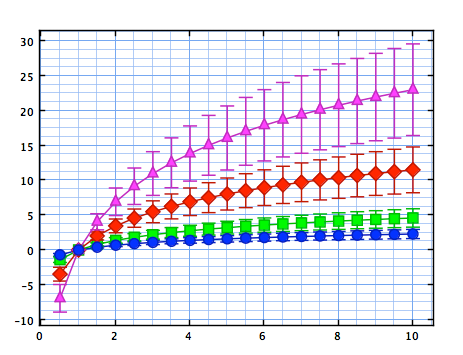
% Create a figure...
f = GXFigure();
% ... and a single graph
ax = subplot(f,1,1,1);
% Position the underlying MATLAB figure window
set(gcf, 'Units', 'normalized', 'Position', [0.1 0.1 0.8 0.8], 'Name', 'TestError');
% Create some "data"
x = 0.5 : 0.5 : 10;
y = log(x);
% Add an errorbar plot to the graph - keep a reference to it in a1
a1 = errorbar(ax, x, y, y/3.5, 'LineSpec', '-ob');
% Add more errorbars - but as children of the first plot.
% They can therefore share the xData of the first plot
% [N.B. Each error bar plot contains 3 plots at the Java level: a scatter,
% line and error bar plot so there are 12 plots in all here].
errorbar(a1, [], y*2, y/3.5*2,'LineSpec', '-sg');
errorbar(a1, [], y*5, y/3.5*5, 'LineSpec', '-dr');
Y = errorbar(a1, [], y*10, y/3.5*10, 'LineSpec', '-^m');
% Finally, scale the graph to accommodate this plots.
ax.getObject().getView().autoScale();
